Project
Grafana Monitoring System
System monitoring and alerting for AWS infrastructure using Grafana, Loki, CloudWatch, and Prometheus.
Overview
We managed and maintained multiple client infrastructures running on AWS, where uptime, performance, and visibility were critical. To ensure system reliability, we implemented a centralized monitoring and alerting solution using Grafana as the primary observability platform.
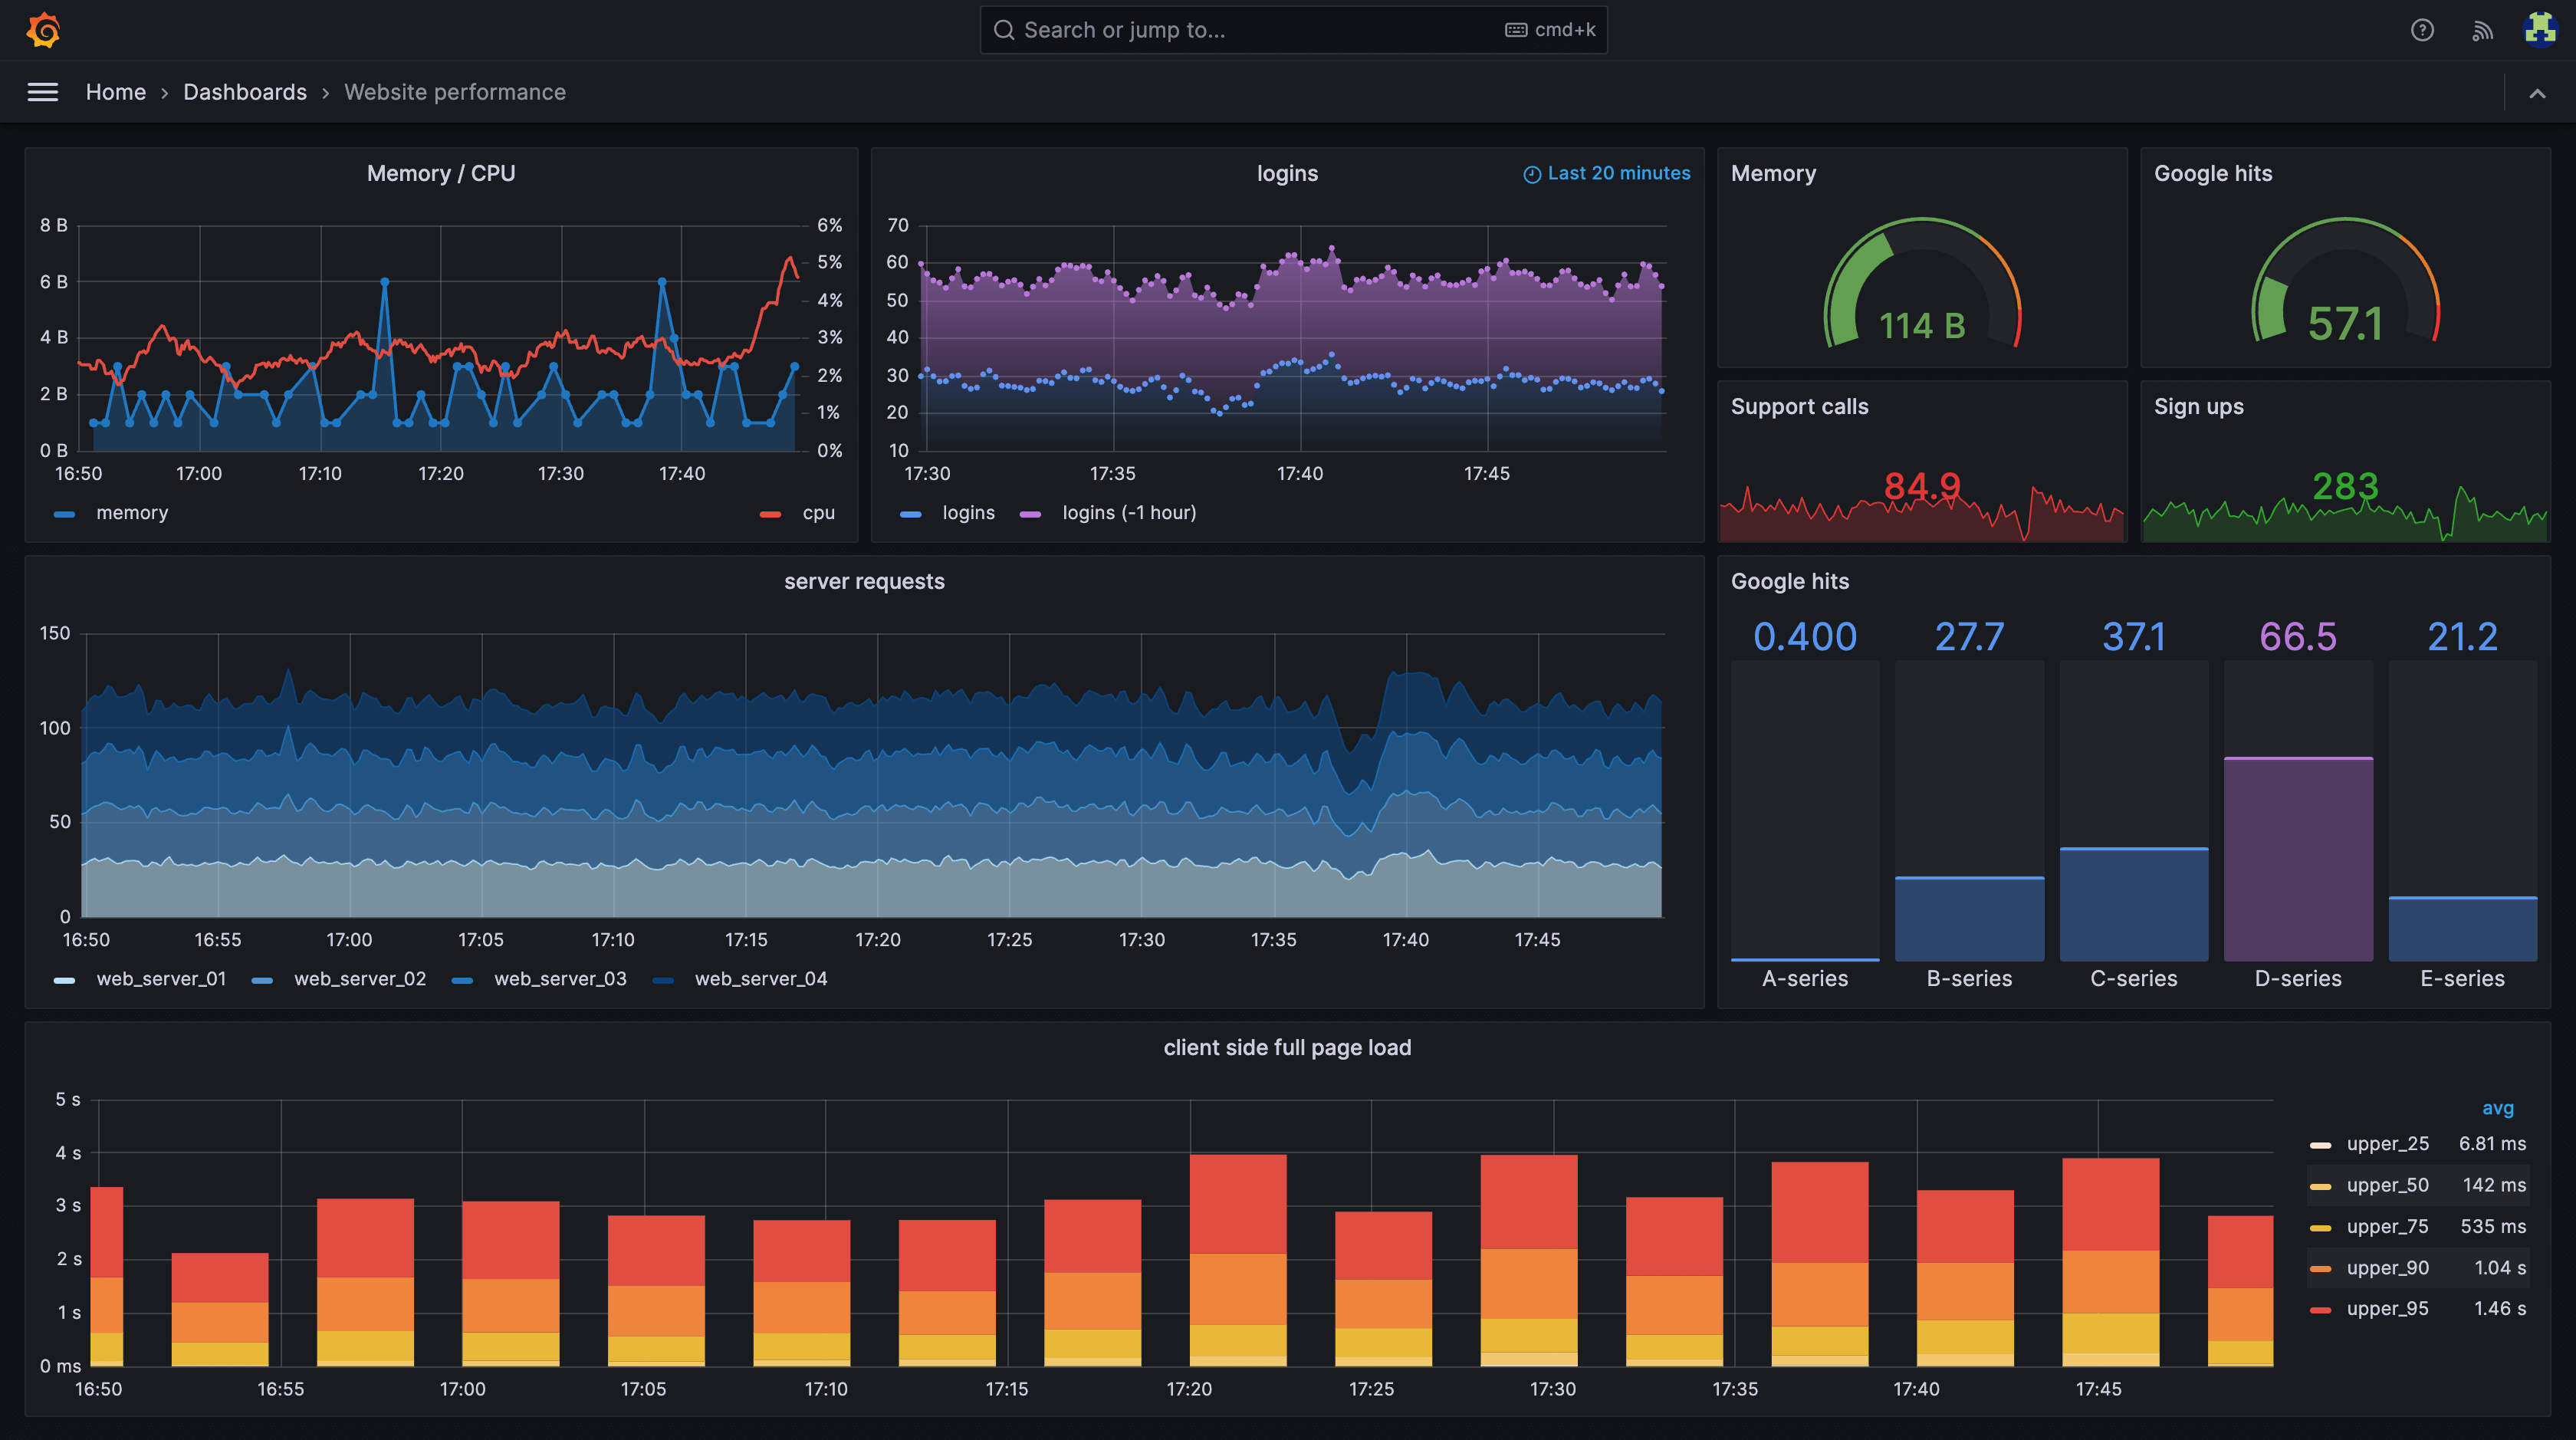
This system provided real-time insights into infrastructure health, application performance, background jobs, and batch processes—allowing us to proactively respond to issues before they impacted end users.
Problem
Our clients operated a mix of:
- Web applications
- Background workers and scheduled batch scripts
- Auto-scaled AWS infrastructure
The main challenges were:
- Limited visibility across services and environments
- Delayed detection of performance degradation
- Difficulty debugging failures in background and batch jobs
- Manual scaling that reacted too late to traffic spikes
Solution
We designed and implemented a Grafana-based monitoring stack integrated with AWS services and open-source observability tools.
Key Feature
- Grafana – Centralized dashboards and alerting
- CloudWatch – AWS-native metrics (EC2, ECS, RDS, ALB, Lambda)
- Prometheus – Application and infrastructure metrics
- Loki – Centralized log aggregation for apps and batch scripts
- Slack – Real-time alerts and notifications
- Infrastructure as Code (IaC) – Automated scaling and configuration
Monitoring Architecture
Metrics Monitoring
- Collected infrastructure metrics from CloudWatch
- Scraped application-level metrics using Prometheus
- Visualized CPU, memory, disk, network, request latency, and error rates in Grafana dashboards
Log Monitoring
- Integrated Loki to collect logs from:
- Web applications
- Background workers
- Scheduled and batch scripts
- Enabled fast log searching to quickly identify:
- Script failures
- Unexpected exceptions
- Data processing errors
Alerting & Automation
- Configured Grafana alert rules based on thresholds such as:
- High CPU or memory usage
- Increased error rates
- Failed batch jobs
- Alerts were sent directly to Slack, enabling rapid response
- When thresholds were exceeded, Infrastructure as Code was used to:
- Scale services automatically
- Adjust resource capacity safely and consistently
Outcome
- 🚨 Faster incident detection through real-time alerts
- 📊 Full visibility across infrastructure, applications, and scripts
- ⚙️ Automated scaling reduced downtime during traffic spikes
- 🔍 Improved debugging of batch jobs and background processes
- 📉 Reduced operational risk with proactive monitoring
This monitoring system allowed us to manage multiple client environments efficiently while maintaining high reliability and performance.
Tech Stack
- Grafana
- AWS CloudWatch
- Prometheus
- Loki
- Slack
- Infrastructure as Code (Terraform / CloudFormation)
- AWS (EC2, ECS, RDS, Lambda)
Conclusion
By implementing a unified monitoring and alerting system with Grafana, we helped our clients achieve better observability, faster incident response, and scalable infrastructure. This setup ensured that both web applications and background processes were continuously monitored, resilient, and easy to maintain.